Dashboard Widgets
Widgets are the core components that make up a Dashboard. They help you visualize and summarize the data stored in your Apps.
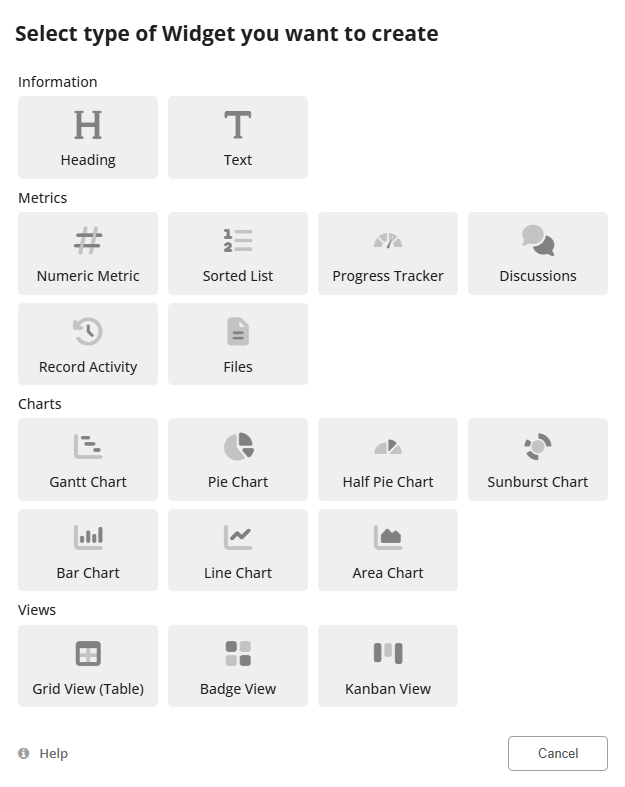
There are different types of widgets which can be added to a Dashboard:
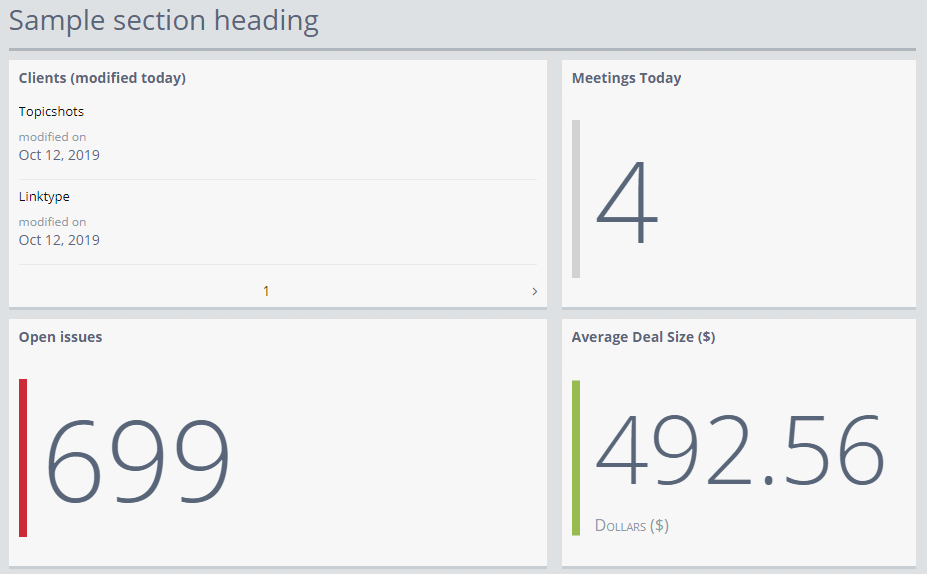
Heading
The Heading widget is used to organize your Dashboard. It can be used to divide the Dashboard in sections making it easier to view important information at a glance. Learn more.
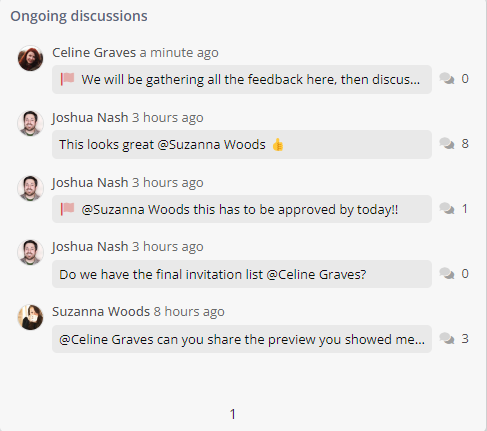
Discussions Widget
The Discussion widget is designed to streamline your communication and keep you in the loop across various Apps. Learn more.
Text Widget
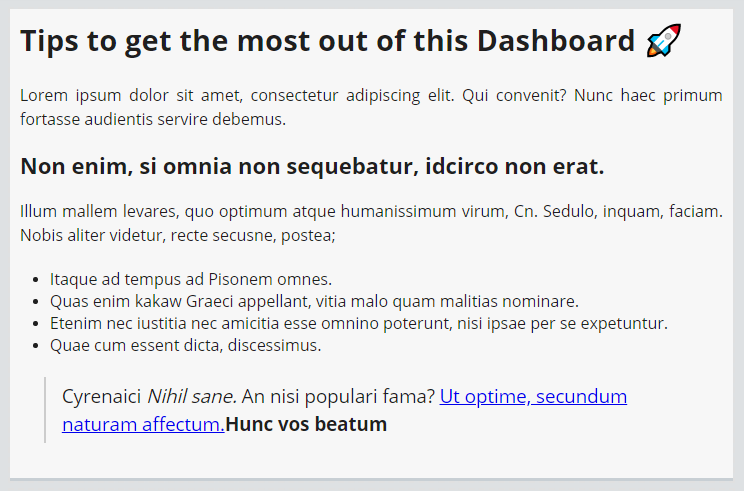
The Text widget lets you write rich text notes that provide additional context to your Apps. You can add text, links, images and even embedded videos to your Dashboards. Learn more.
List & Kanban View
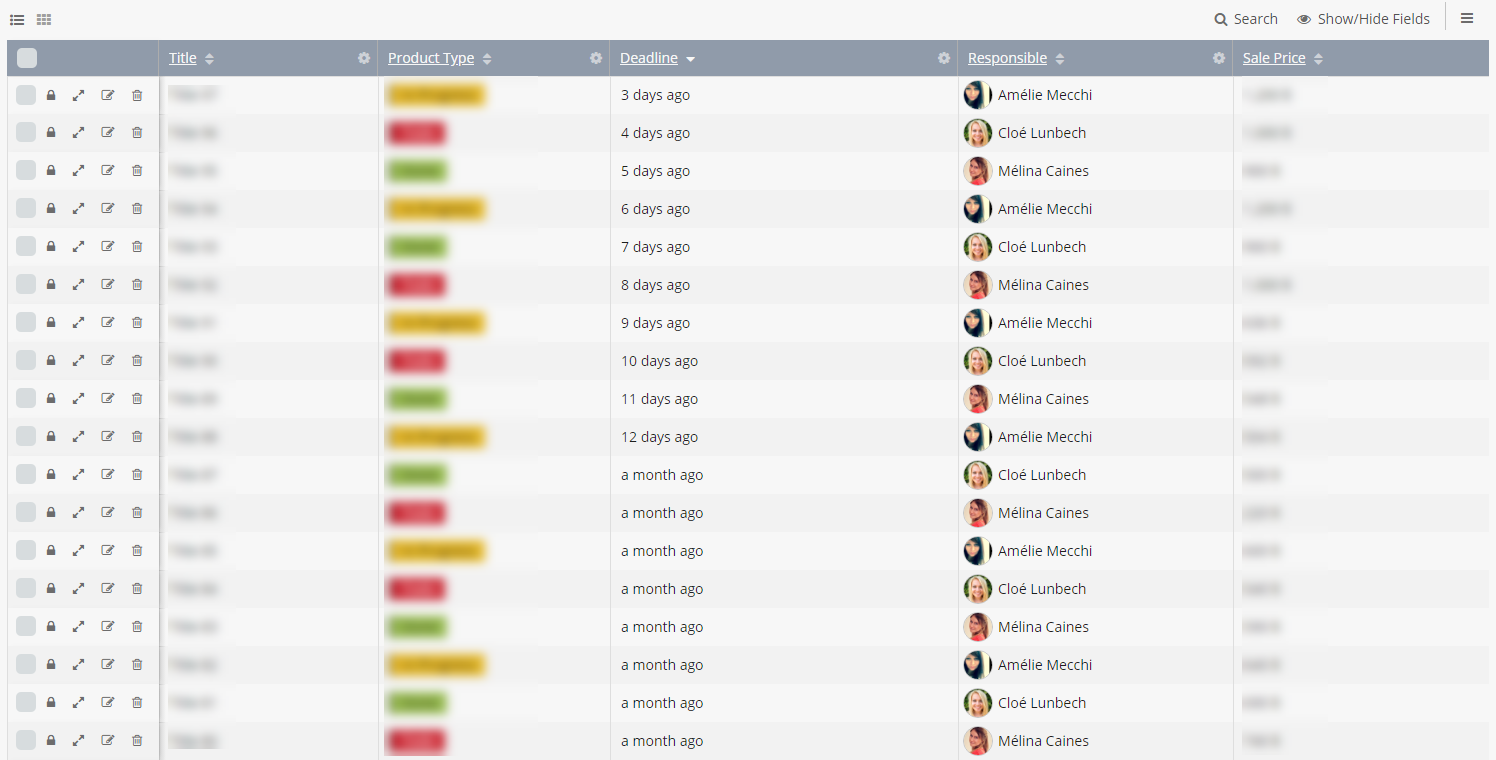
This widget lets you interact with your data. You can view, edit, delete and create records from within this widget. There are different views which can be used to visualize the data. Learn more.
Numeric Metric
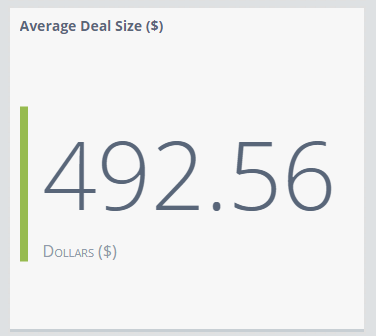
The Numeric Metric helps you visualize and keep track of key App metrics. Learn more.
Progress Tracker
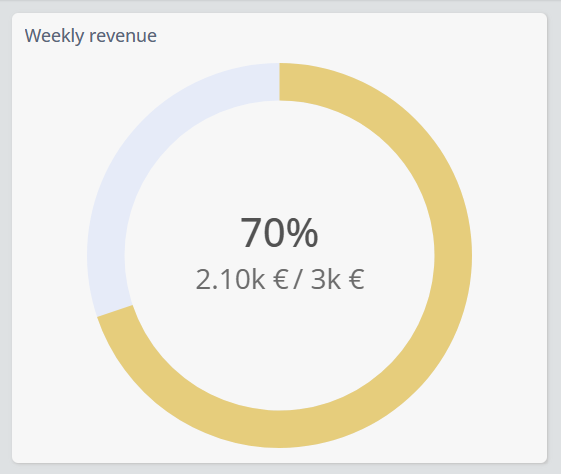
The Progress Tracker is a versatile tool designed to visually represent progress toward specific objectives. Learn more.
Sorted List
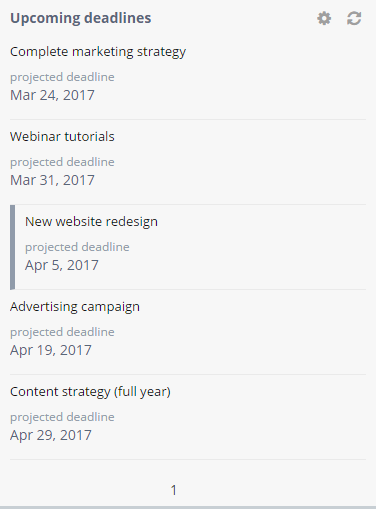
The Sorted List Widget helps you visualize a top/bottom 10 record list. Records can be sorted by a Number or a Date Field. Learn more.
Gantt Chart
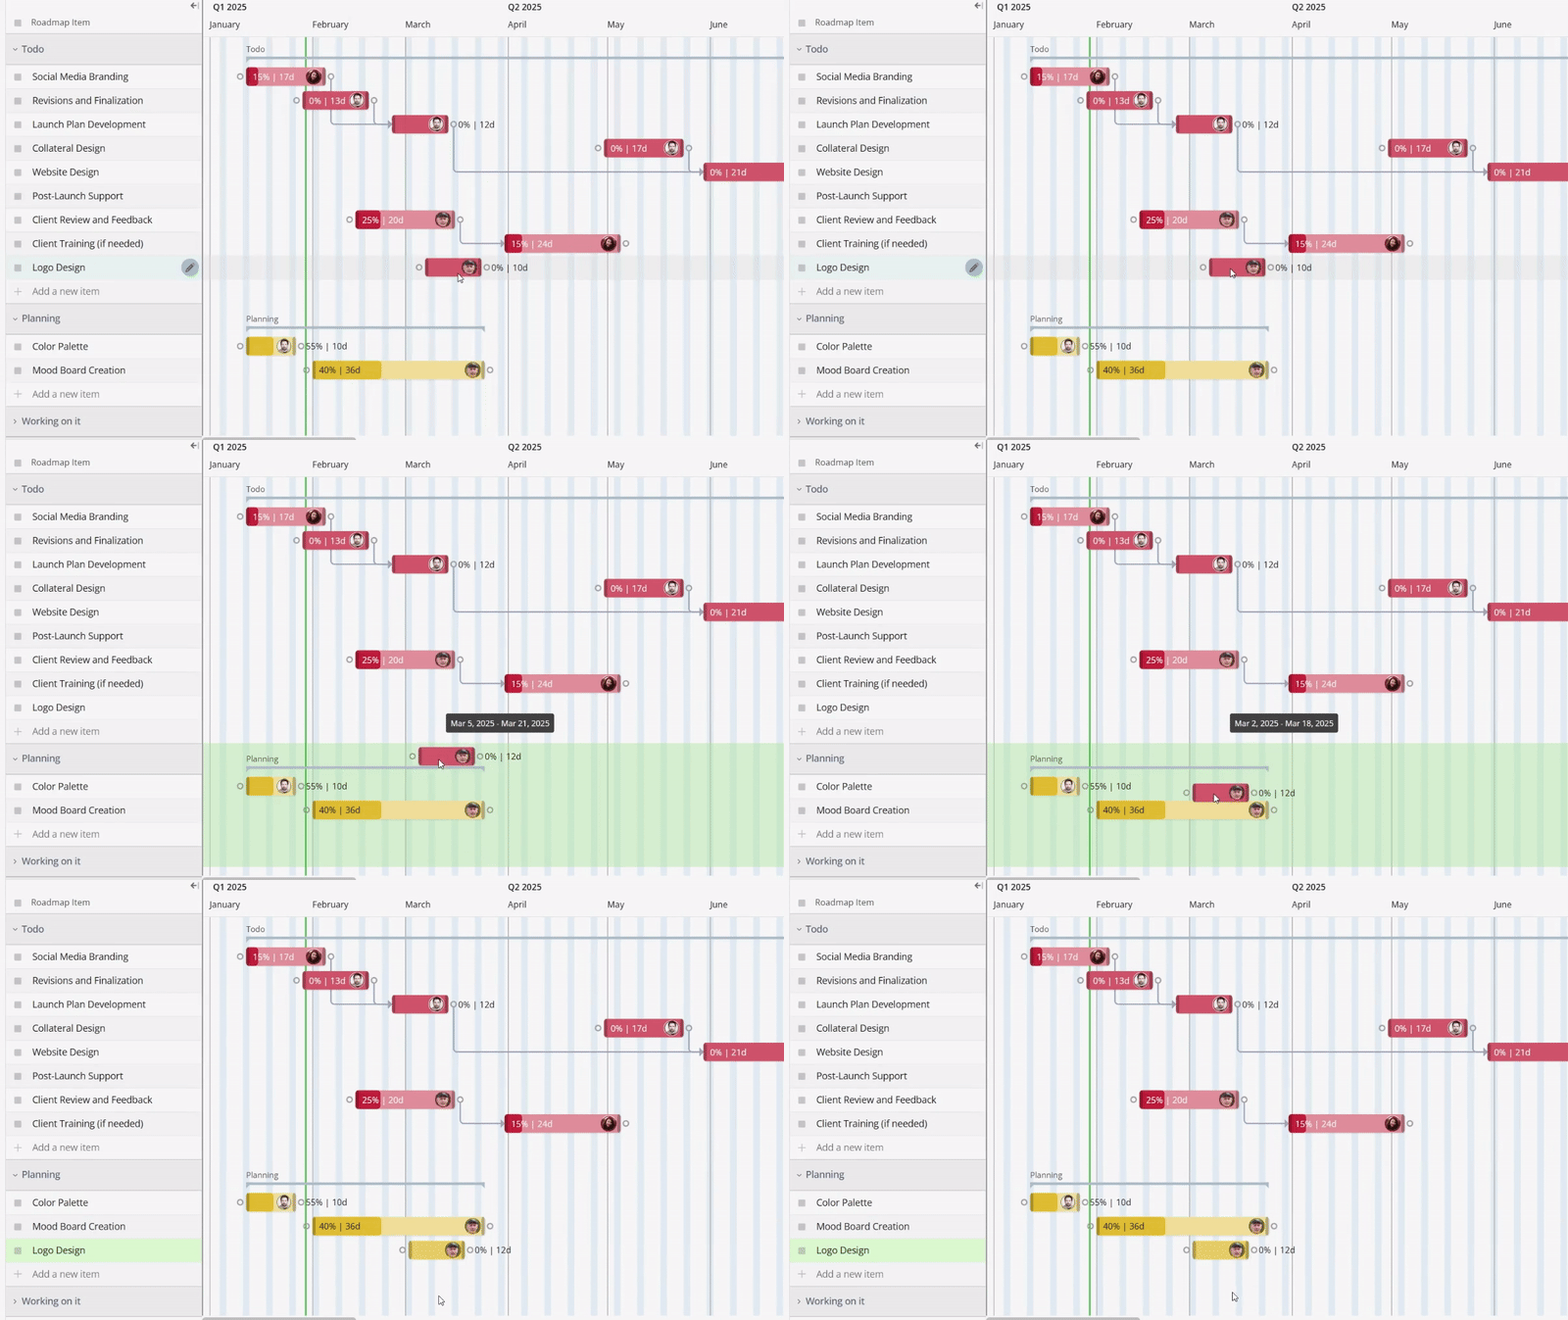
The Gantt Chart widget is a powerful tool designed to enhance project management by providing a visual timeline of tasks and their progress. Learn more.
Pie Chart
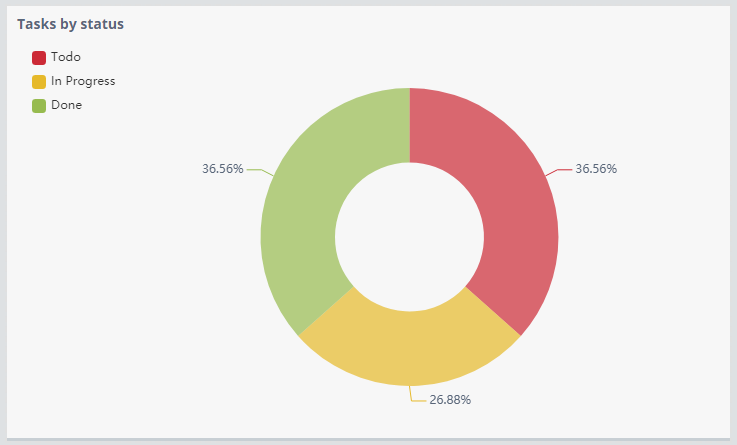
The Pie Chart helps you proportionally compare different data categories. Learn more.
Line Chart
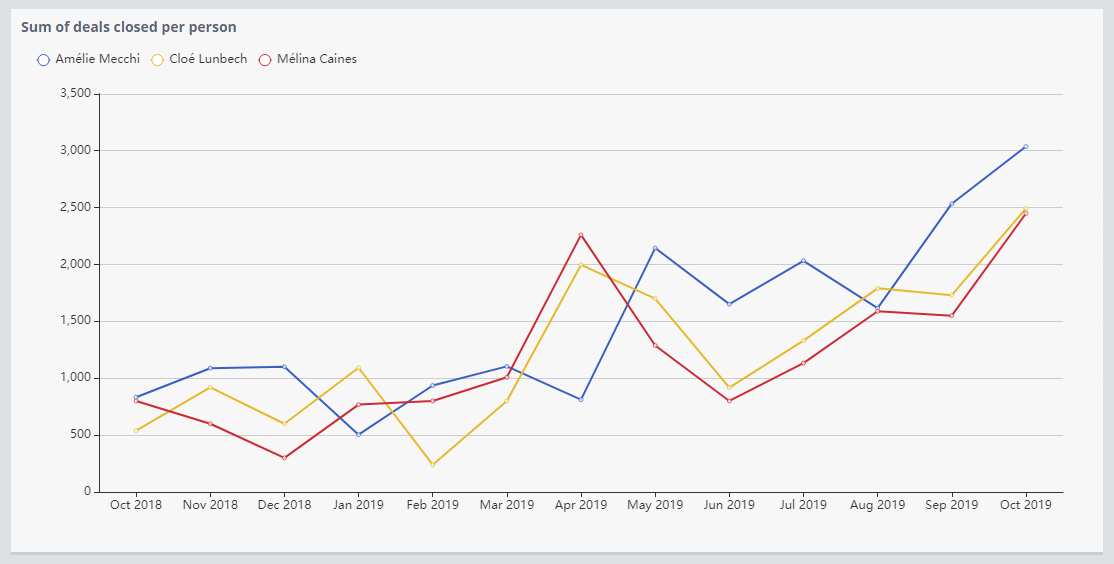
The Line Chart helps you visualize a trend in data over intervals of time. Learn more.
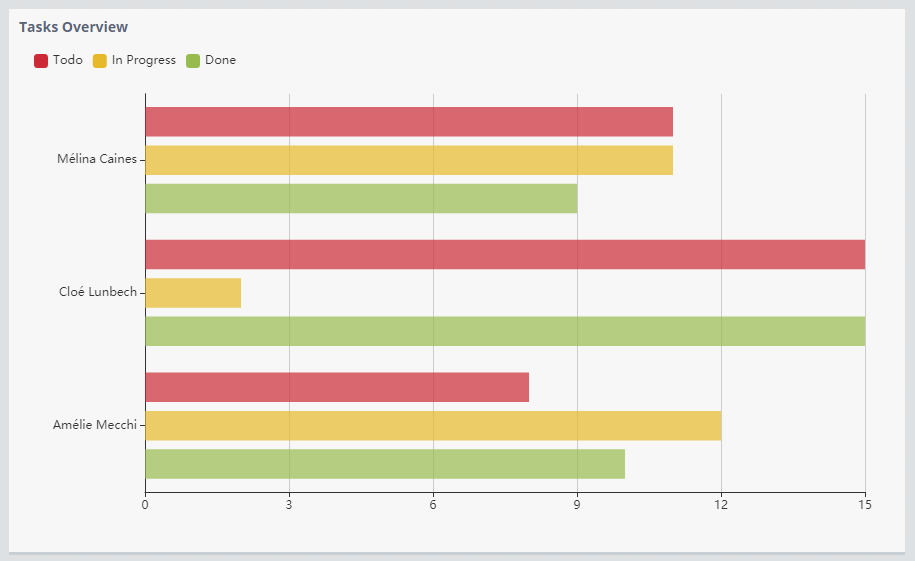
Bar Chart
The Bar Chart is used to display and compare different categories of data.
